
This Sunday I learned about using the wheel of life in self-coaching and taught myself Google App script programming.
The Wheel of Life is a coaching device to assess current environment conditions before and during development. It applies to personal development as well as professional development, just the labels vary. I was introduced to this device by a mail from Michael Heppell in his program 90 days of brilliance, itself introduce to us by Michelle Ockers in a tweet during the holidays.
How I came there
I thought it fits well in my work on self-accountability and tracking I undertake just before the holidays. I’m planning to have a nice dashboard showing my progress and the wheel sounds like a perfect way to collect how I judge my context. It’s also a tool to set goals, he topic of next #PKMChat on Goals for Professional Development that I’m due to prepare today. By measuring the gaps between assessed and expected measures along the 8 axes one can focus efforts where it’s more important. This goes with values and strengths analysis I started on my personal blog. More to come on this direction.
Sunday hack
The idea came as I was doing my morning walk. I just posted about my new timesheet and had started reading. This was before starting with my dominant task of the day which is a big error I realized later.
The idea was to produce a small app, totally independent from Kneaver, totally client side to produce such a drawing and keep track of progress. Something anybody could use.
Now, I though, what is the best place to store life data like this? It has to be persistent overtime so a client-side app has only the option of using browser HTML5 data storage. A great solution for short todo lists but not for something you want to keep over months. If I keep it on one of my sites I’m led to update in a dramatic way the privacy policy I just wrote. Last alternative was to use a GoogleSheet. Everyone knows how to use it, it’s private, under everyone’s control.
Next my idea was to create a webapp in plain HTML5 and javascript as I know how to do. If the data is in a google sheet I will have to learn how to access it. I did my homework, my PKM routine when I face a lack of knowledge in a field: a short google search followed by a short overlook to 10 or 15 seemingly relevant pages. I realized that “Google Sheet” actually has it’s own development environment: Google App script. It’s in javascript, very similar to NodeJS I’m already using and Apache Cordova and Electron I learned last week. it taps directly in the sheet, displays as HTML5 and is served by Google Store. All good points for me. Let’s share my excitement.
Learning Goog App Script, have an idea and want to broaden my knowledge outside my comfort zone.(lifelong agile autonomous learner!)
— Bruno Winck (@brunowinck) January 3, 2016
I did my usual PKM routine once more. I searched for posts and documents on using Google Script. My secondary goal was to give a try at using d3.js a charting library using svg (check their site it’s inspiring). I did some extra reading to make sure that it supports svg and some tests by placing the svg picture from #PKMChat inside it: It works. I found the corresponding d3.js design: it’s called a radar graph. Odds looks in my favor that this hack will succeed in time. Let’s do it.
Learning Goog App Script, have an idea and want to broaden my knowledge outside my comfort zone.(lifelong agile autonomous learner!)
— Bruno Winck (@brunowinck) January 3, 2016
So basically (skip this if you are not willing to learn to code):

1. Create a sheet, a normal one. This is mine.
2. Tools -> Script Editor
3. You are presented with code.gs, that’s where you type your server side javascript.
4. File -> New -> HTML file -> name it “Index.html” <- important the name must be exact case wise.
5. Modify the HTML page like any normal page, same as you blog. Say we add "Hello World" between body tags.
6. paste this in myFunction
  var html2 = HtmlService.createTemplateFromFile(‘Index’)

      .evaluate()

      .setSandboxMode(HtmlService.SandboxMode.IFRAME);

  SpreadsheetApp.getUi() // Or DocumentApp or FormApp.

      .showModalDialog(html2, ‘Wheel of Life’);
7. Try using the Go button (black triangle icon).
8. A dialog with “hello World” should appear in your sheet.
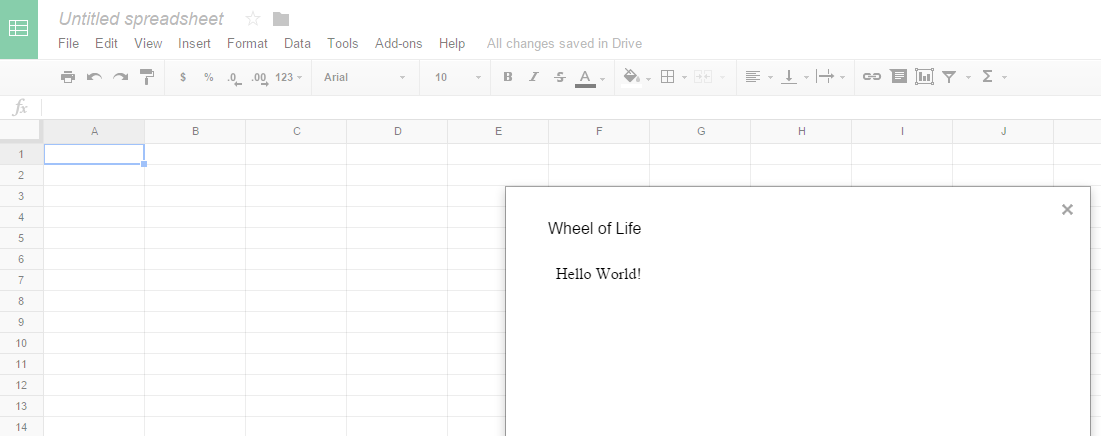
I made it after a few iterations
It took me exactly 2 hours from start to finish. Check the tweets time.
After I completed it I tried also using Google Charts, the normal way to produce charts from sheets. Thereis a radar option but it’ way less attractive than my result _and_ it’s not interactive. On my result, thanks to d3.js you have extra details when you hover the graph. that’s a win, first time one of my design surpass Google 🙂 The Google Chart is displayed in the sheet, behind the dialog.
First experiment of d3.js, Google App and Scripting Google Sheets, always learning something new. MyProductivityApp pic.twitter.com/7EGJvPmsnl
— Bruno Winck (@brunowinck) January 4, 2016
As you see I arranged the sheet so that Labels can be changed. If you are more enclined to use it for professional development this variant may suit you better. Each column corresponds to a sample. You could set the first column as the current evaluation and the second as your goal and start adding more columns as you continue your development. Stick to 8 axes, try to keep the order of axes in a way that makes sense otherwise the graph will appear more distorted than necessary. The goal is to identify places where the shape goes inward as it is likely places of progress or hindrances in your harmonious development.
Now my next step was to publish it so that everyone could use it. I was a bit concerned by possible right infringement on the name and design. So I did a search on Google, applying my PKM tactic once again. I found tons of links on “Wheel of Life”. I explored a few interesting ones and collected some findings on Diigo for the next #PKMChat. One stone, two birds 🙂
I learned:
– That this wheel is commonly used as a coaching device, among many others. Always interesting to know for my own guidance and for building apps.
– Various variants.
– How to evaluate every dimension.
– How to use results.
That took me an extra hour.
What I learned
– using d3.js, it was my first experience of it.
– using Google App script.
– Using Google Chrome store. First time I publish an app.
– Using the Wheel Of life
– How coaches are organizing their business. I have no intention to become a coach but I’m intrigued.
and now, what’s next
Based on the results of my search I published the app. You can find it here and use it on your data without any communication with Kneaver. In your sheet use the menu Addons -> get Addons. Search “Wheel of Life”, you should get it.
I used it for me, I’ll keep my assessment private for now. Numbers found in the sheets I shared are for test only 🙂
Okay, that was nice but in the process, I lost the compass of my day plan that was to finalize the store. I placed it as the frog to eat before lunch for today. See you later if I survive this meal 🙂 I hesitate this morning. I felt I had the inspiration for this post but saw the risk also that by delaying the frog meal it could eventually be difficult to place it before a regular meal was due. I pondered a while I though that if i write quickly it could be done. That’s one of my PD objectives for 2016: write more, more often faster.
What are your goals? how did you define them? Please feel free to share your experience or a link to a post you wrote in the comments below.
PS: Did you notice I’m placing more links on every new term I introduce? It’s because I installed Better Internal Link Search plugin. I’m thinking of extending it to include Kneaver searches (which will also search in Twitter, Diigo and Evernote). What do you think?